Strategy Tester Report
AlpariUK-Demo (Build 225)
| Symbol | EURUSD (Euro vs US Dollar) | ||||
| Period | 1 Hour (H1) 2009.12.01 00:00 - 2010.01.15 22:00 (2009.12.01 - 2010.01.17) | ||||
| Model | Control points (a very crude method, the results must not be considered) | ||||
| Parameters | Lots=0.1; StopLoss=0; StopLossOnTenth=0; Use_Auto_TakeProfit=false; TakeProfit=0; TrailingStop=5; MaxTrades=10; Pips=20; SecureProfit=10; AccountProtection=1; OrderstoProtect=3; ReverseCondition=0; EURUSDPipValue=10; GBPUSDPipValue=10; USDCHFPipValue=7.94; USDJPYPipValue=9.03; mm=0; risk=12; AccountisNormal=1; TimeZoneofData=0; | ||||
| Bars in test | 1753 | Ticks modelled | 19953 | Modelling quality | n/a |
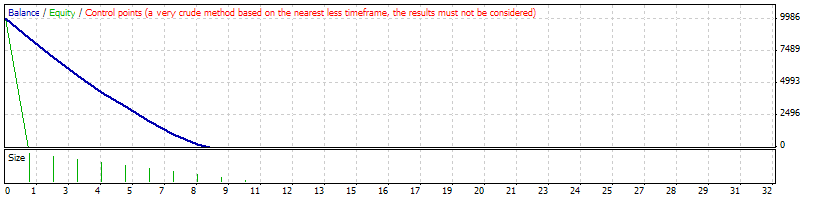
| Mismatched charts errors | 1 | ||||
| Initial deposit | 10000.00 | ||||
| Total net profit | -10648.10 | Gross profit | 0.00 | Gross loss | -10648.10 |
| Profit factor | 0.00 | Expected payoff | -1064.81 | ||
| Absolute drawdown | 10648.10 | Maximal drawdown | 12943.00 (105.27%) | Relative drawdown | 105.27% (12943.00) |
| Total trades | 10 | Short positions (won %) | 0 (0.00%) | Long positions (won %) | 10 (0.00%) |
| Profit trades (% of total) | 0 (0.00%) | Loss trades (% of total) | 10 (100.00%) | ||
| Largest | profit trade | 0.00 | loss trade | -1525.60 | |
| Average | profit trade | 0.00 | loss trade | -1064.81 | |
| Maximum | consecutive wins (profit in money) | 0 (0.00) | consecutive losses (loss in money) | 10 (-10648.10) | |
| Maximal | consecutive profit (count of wins) | 0.00 (0) | consecutive loss (count of losses) | -10648.10 (10) | |
| Average | consecutive wins | 0 | consecutive losses | 10 | |
| # | Time | Type | Order | Size | Price | S / L | T / P | Profit | Balance |
| 1 | 2009.12.01 00:00 | buy | 1 | 0.10 | 1.50090 | 0.00000 | 0.00000 | ||
| 2 | 2009.12.01 00:20 | buy | 2 | 0.20 | 1.50043 | 0.00000 | 0.00000 | ||
| 3 | 2009.12.01 06:10 | buy | 3 | 0.30 | 1.49980 | 0.00000 | 0.00000 | ||
| 4 | 2009.12.01 06:15 | buy | 4 | 0.40 | 1.49868 | 0.00000 | 0.00000 | ||
| 5 | 2009.12.01 06:20 | buy | 5 | 0.50 | 1.49719 | 0.00000 | 0.00000 | ||
| 6 | 2009.12.04 14:50 | buy | 6 | 0.60 | 1.49283 | 0.00000 | 0.00000 | ||
| 7 | 2009.12.04 15:02 | buy | 7 | 0.70 | 1.49177 | 0.00000 | 0.00000 | ||
| 8 | 2009.12.04 15:07 | buy | 8 | 0.80 | 1.49129 | 0.00000 | 0.00000 | ||
| 9 | 2009.12.04 16:45 | buy | 9 | 0.90 | 1.49019 | 0.00000 | 0.00000 | ||
| 10 | 2009.12.04 16:50 | buy | 10 | 1.00 | 1.48883 | 0.00000 | 0.00000 | ||
| 11 | 2009.12.08 14:20 | close at stop | 10 | 1.00 | 1.47357 | 0.00000 | 0.00000 | -1525.60 | 8474.40 |
| 12 | 2009.12.08 14:20 | close at stop | 9 | 0.90 | 1.47357 | 0.00000 | 0.00000 | -1495.44 | 6978.96 |
| 13 | 2009.12.08 14:20 | close at stop | 8 | 0.80 | 1.47357 | 0.00000 | 0.00000 | -1417.28 | 5561.68 |
| 14 | 2009.12.08 14:20 | close at stop | 7 | 0.70 | 1.47357 | 0.00000 | 0.00000 | -1273.72 | 4287.96 |
| 15 | 2009.12.08 14:20 | close at stop | 6 | 0.60 | 1.47357 | 0.00000 | 0.00000 | -1155.36 | 3132.60 |
| 16 | 2009.12.08 14:20 | close at stop | 5 | 0.50 | 1.47357 | 0.00000 | 0.00000 | -1180.30 | 1952.30 |
| 17 | 2009.12.08 14:20 | close at stop | 4 | 0.40 | 1.47357 | 0.00000 | 0.00000 | -1003.84 | 948.46 |
| 18 | 2009.12.08 14:20 | close at stop | 3 | 0.30 | 1.47357 | 0.00000 | 0.00000 | -786.48 | 161.98 |
| 19 | 2009.12.08 14:20 | close at stop | 2 | 0.20 | 1.47357 | 0.00000 | 0.00000 | -536.92 | -374.94 |
| 20 | 2009.12.08 14:20 | close at stop | 1 | 0.10 | 1.47357 | 0.00000 | 0.00000 | -273.16 | -648.10 |